 Week Two has arrived at The Scottish House of Insight.
Last week, we asked whether a reassuring portfolio could really be trusted when some of the evidence was out of date [we’ve got the answer to that one here]
This week, the numbers look positive again.
Stakeholder sentiment is high. Confidence is strong. The project is Green.
So what’s the problem?
One detail changes the picture.
Welcome to The Project Everyone Seems to Love.
This week’s challenge is all about interpretation, context and whose voice really matters when the PMO is trying to support a good decision.
Look closer.
Week Two: The Project Everyone Seems to Love
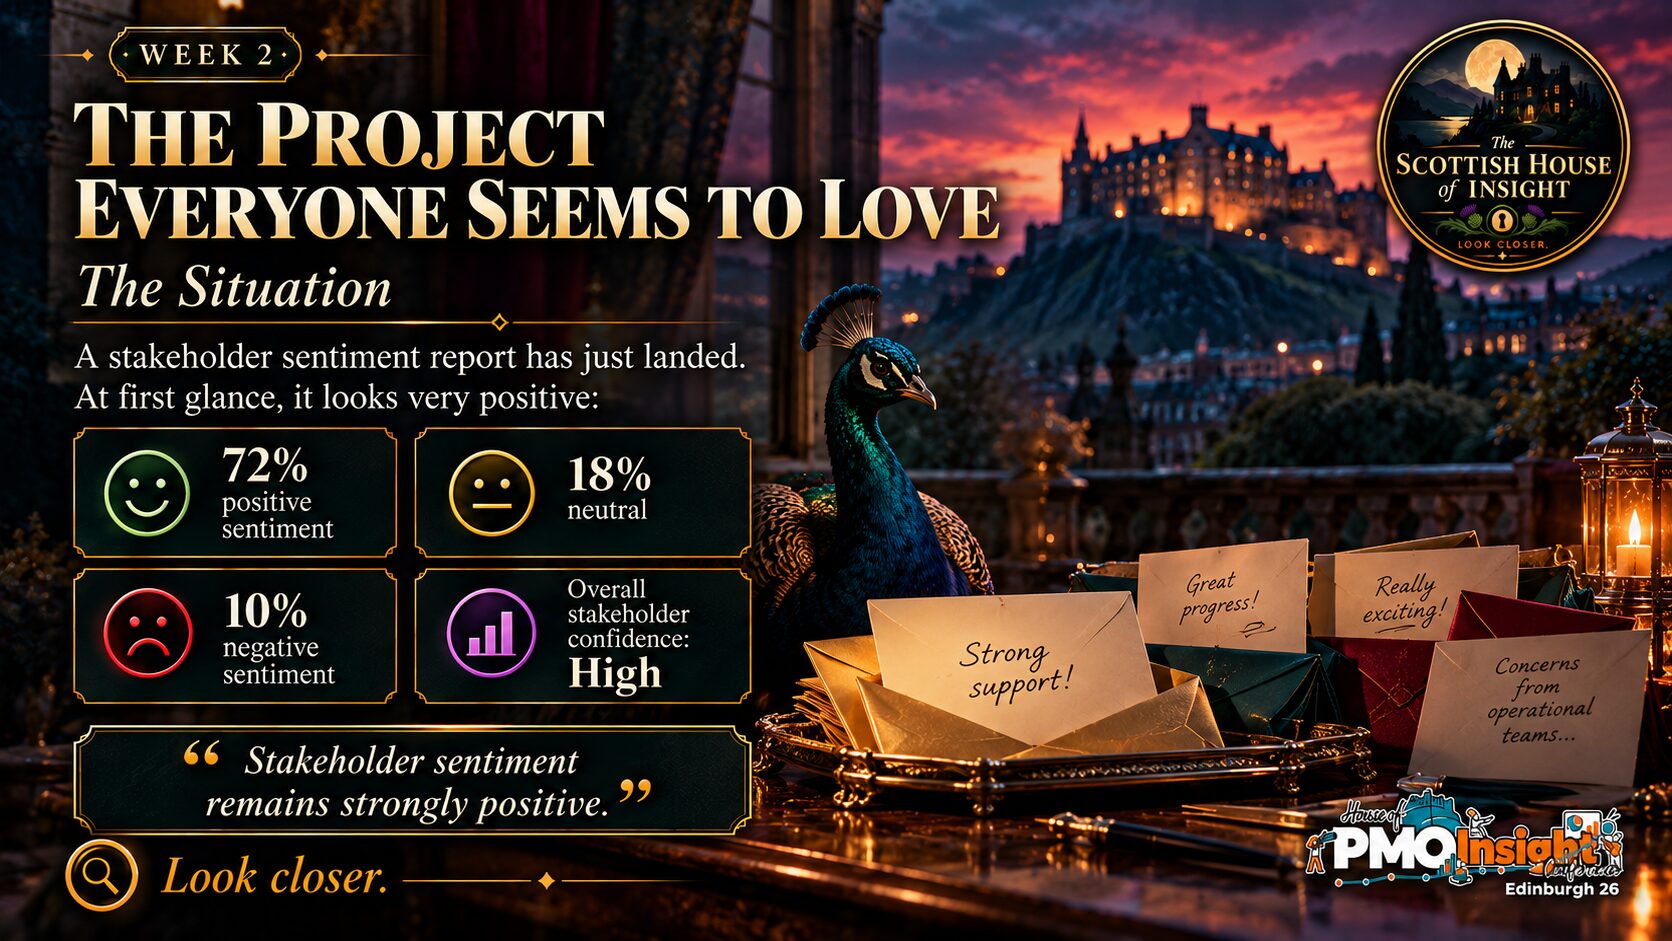
Take in the headline figures and the overall picture being presented.
Don’t decide yet!

Read the extra evidence carefully.
Ask yourself what this new detail changes about the original conclusion.

The answer was B
Whether the sentiment results reflect the importance and influence of different stakeholder groups.
The 72% positive figure may be completely accurate.
That is not really the problem.
The problem is what we decide it means.
A single percentage can make all stakeholder views look equally important, but in practice they rarely are.
If the people who will be most affected by a change — and who will ultimately have to make it work – are disproportionately negative, then that deserves attention even if they are a relatively small part of the overall survey response.
It does not automatically mean they are right.
It does not mean the majority should be ignored.
It means the PMO needs to understand the context behind the number before deciding how much confidence to place in it.
A good score can still hide something important
This is one of the reasons I find stakeholder data interesting.
We like percentages because they make complicated things look tidy.
72% positive sounds clear.
But the next question has to be:
Who is positive, who is negative, and how much does that matter to the decision we are making?
Imagine asking 100 people whether they like a new operational process.
If 72 people who barely interact with it are positive, but most of the people expected to use it every day are worried about it, that changes the conversation quite considerably.
The number has not become wrong.
It has simply become less useful without the context around it.
What about the other answers?
A. Whether 72% positive is high enough
There is no magic percentage that automatically tells us everything is fine.
Whether 72% is reassuring depends on who responded, what they were asked and what the consequences are for the groups who are less positive.
C. Whether neutral responses should count as positive
Changing the calculation might move the number, but it would not address the real issue.
The important signal is coming from a particular stakeholder group, not from how we categorise the neutral responses.
D. Whether the project should immediately move to Amber
That might eventually be appropriate, but it is too early to jump straight to a status change.
First we need to understand the concerns, how serious they are and whether they are likely to affect adoption or delivery.
E. Whether sentiment analysis should be removed from the dashboard
Quite the opposite.
The sentiment data has actually done something useful here — it has given us a reason to investigate.
The answer is not less information. It is better interpretation.
The wider PMO point
Week One was about whether we could trust the evidence in front of us.
Week Two takes that a little further.
Even when the data itself is perfectly accurate, we can still draw the wrong conclusion from it.
That is where the PMO adds value.
Not simply by presenting the percentage, but by asking what sits underneath it.
Who does this represent?
Whose view could materially affect the outcome?
Is an overall average hiding something we need to understand?
And perhaps most importantly, what would someone reading this dashboard conclude if we did not give them that context?
There is a temptation with data to think that once we have a number, we have an answer.
Usually we have the beginning of a better question.
Sometimes the number is right. It is the interpretation that needs another look.
Look closer.